3.3 Dashboard
  • 09 Apr 2024
  • 3 Minutes to read
  • Dark
    Light
  • PDF

3.3 Dashboard

  • Dark
    Light
  • PDF

Article summary

This article details the navigation of the VulaCoin Dashboard.

a) TopUp, totals and statistics options


image


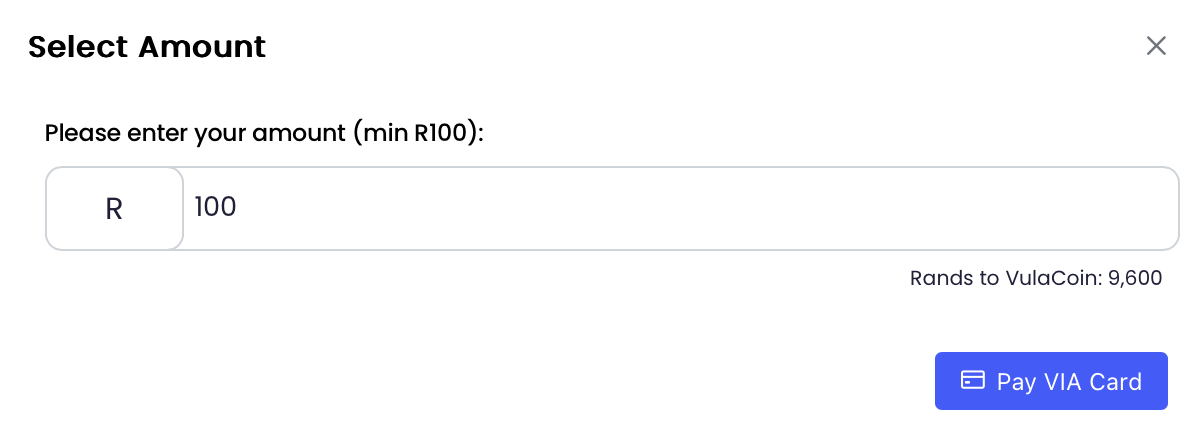
1. Add Funds button - This allows a merchant to TopUp the wallet.

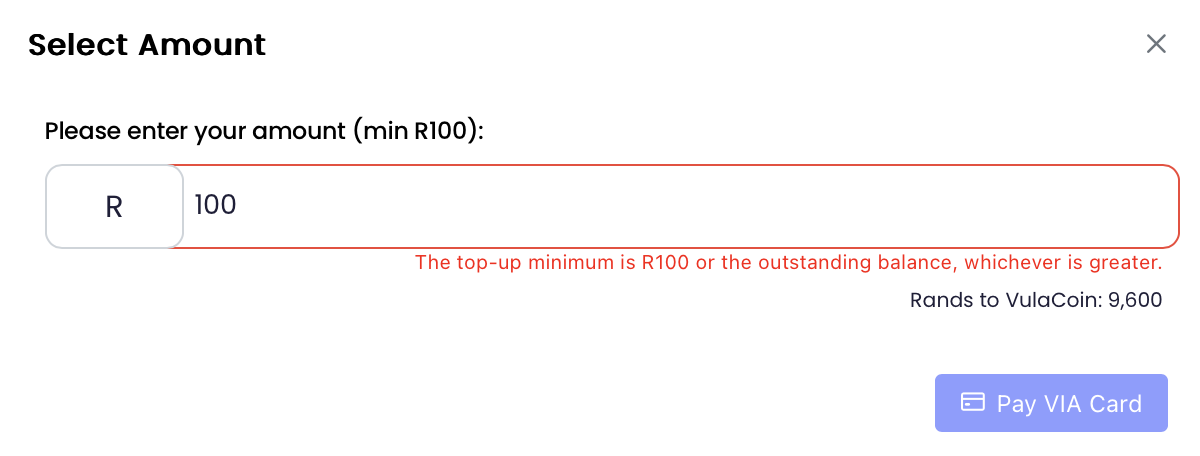
      • The minimum TopUp amount is R100.
      • If the merchant wallet is in the negative, the amount in the negative will be automatically filled as the minimum amount.

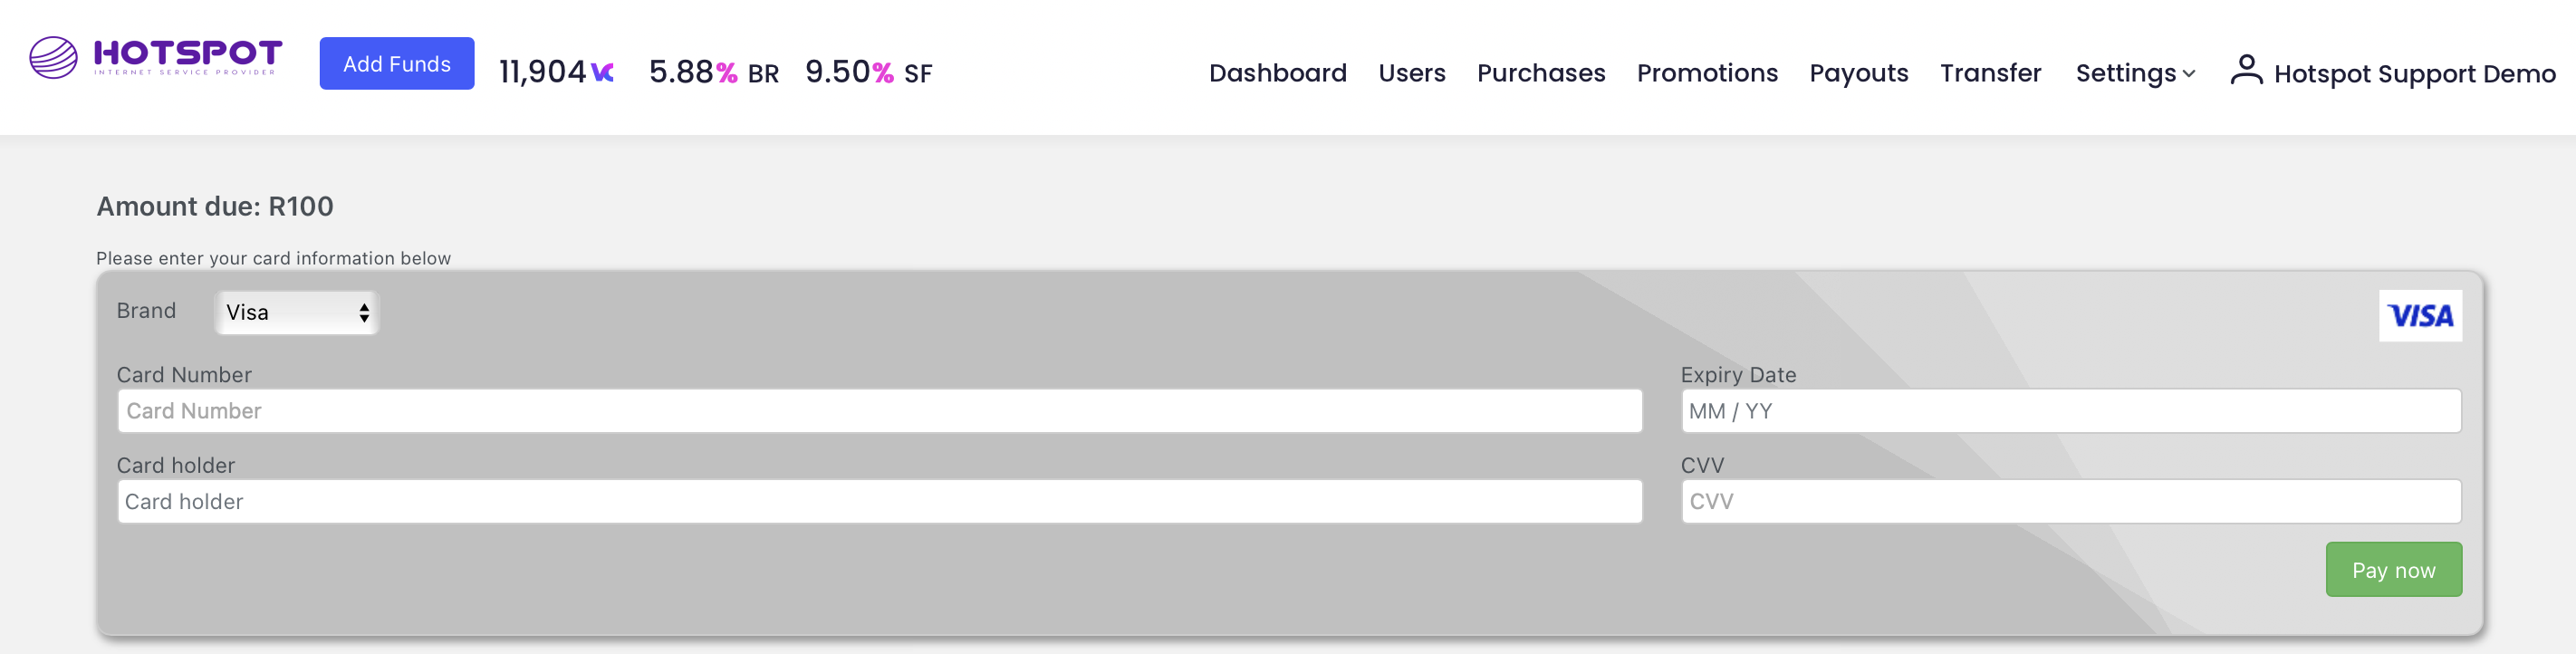
To proceed, click on the "Pay VIA Card" button and enter your card details:

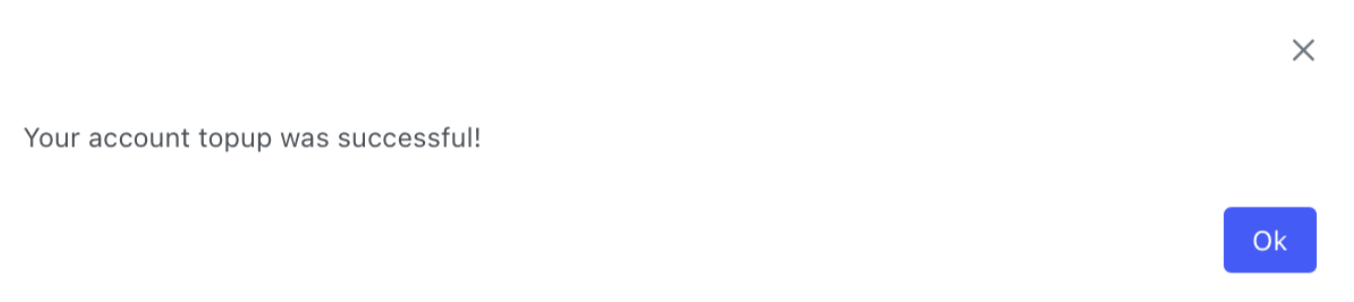
Once payment has been completed, a success banner will be displayed and the funds will be reflected:

2. This number reflects the current total number of VulaCoin that you have available in your account.

3. This number indicates the Blended Cost

      • The aggregated cost charged by payment gateways and exchanges to your company, in respect of all VulaCoin in circulation. 
      • This value will never equal more than 10% of the VulaCoin value.

4. This number indicates the Service Fee

5. Hotspots statistics toggle - this feature can be enabled to show the following VulaConnect statistics.

      • Hotspots
      • Bundles and Devices
      • Hotspot interactions
      • Data Sent
      • Peak Data Sent
      • Peak Customers


b) Metric cards


1. Net Profit Today 

      • Indicates the total net profit on all completed sales since 12AM GMT of the current day.


2. Customers Today 

      • LHS - Indicates the total new customers signed up since 12AM GMT of the current day.
      • RHS - Indicates the total active customers since 12AM GMT of the current day.


3. Avg Purchases Today 

      • Indicates the calculated average of VulaCoin and equivalent ZAR value per user since 12AM GMT of the current day.


4. ZAR Balance - Indicates the current equivalent ZAR available in your account.

      • e.g., R1 = 96 VC
      • e.g., R5 = 480 VC


5. Hotspots  

      • Indicates the current total number of hotspots in your network.


6. Bundles and Devices 

      • LHS - Indicates the current total number of active bundles. Active bundles provide internet access to the user, though they might not be using the internet on any of their authenticated devices. The bundle will become active once it is purchased by the user/customer and will deactivate once the current time passes the expiration time. For example, if a 7-day bundle is purchased by the user it is activated on your network. Once the 7-day period has elapsed, the bundle is deactivated and will not be included in the metric.
      • This metric will indicate the current number of users that have access to the internet through your hotspots and is useful to compare against the total bundles sold.
      • RHS - Indicates the current total number of authenticated devices. Authenticated device are authorised to use bundles on your network.


7. Hotspot Interaction 

      • LHS - Indicates the total number of customer interactions with all hotspots in the last seven days.
      • RHS - Indicates the calculated average number of interactions per hotspot in the last seven days.


8. Data sent 

      • LHS - Indicates the total amount of data that has passed through all hotspots in the last seven days.
      • RHS - Indicates the calculated average amount of data that passed through a hotspot in the last seven days.


c) Top and Weakest Hotspots


This section indicates a list of the top and weakest performing hotspots. This performance is based on the number of bundles purchased on each hotspot in the last seven days. 


d) Graphs and top customers
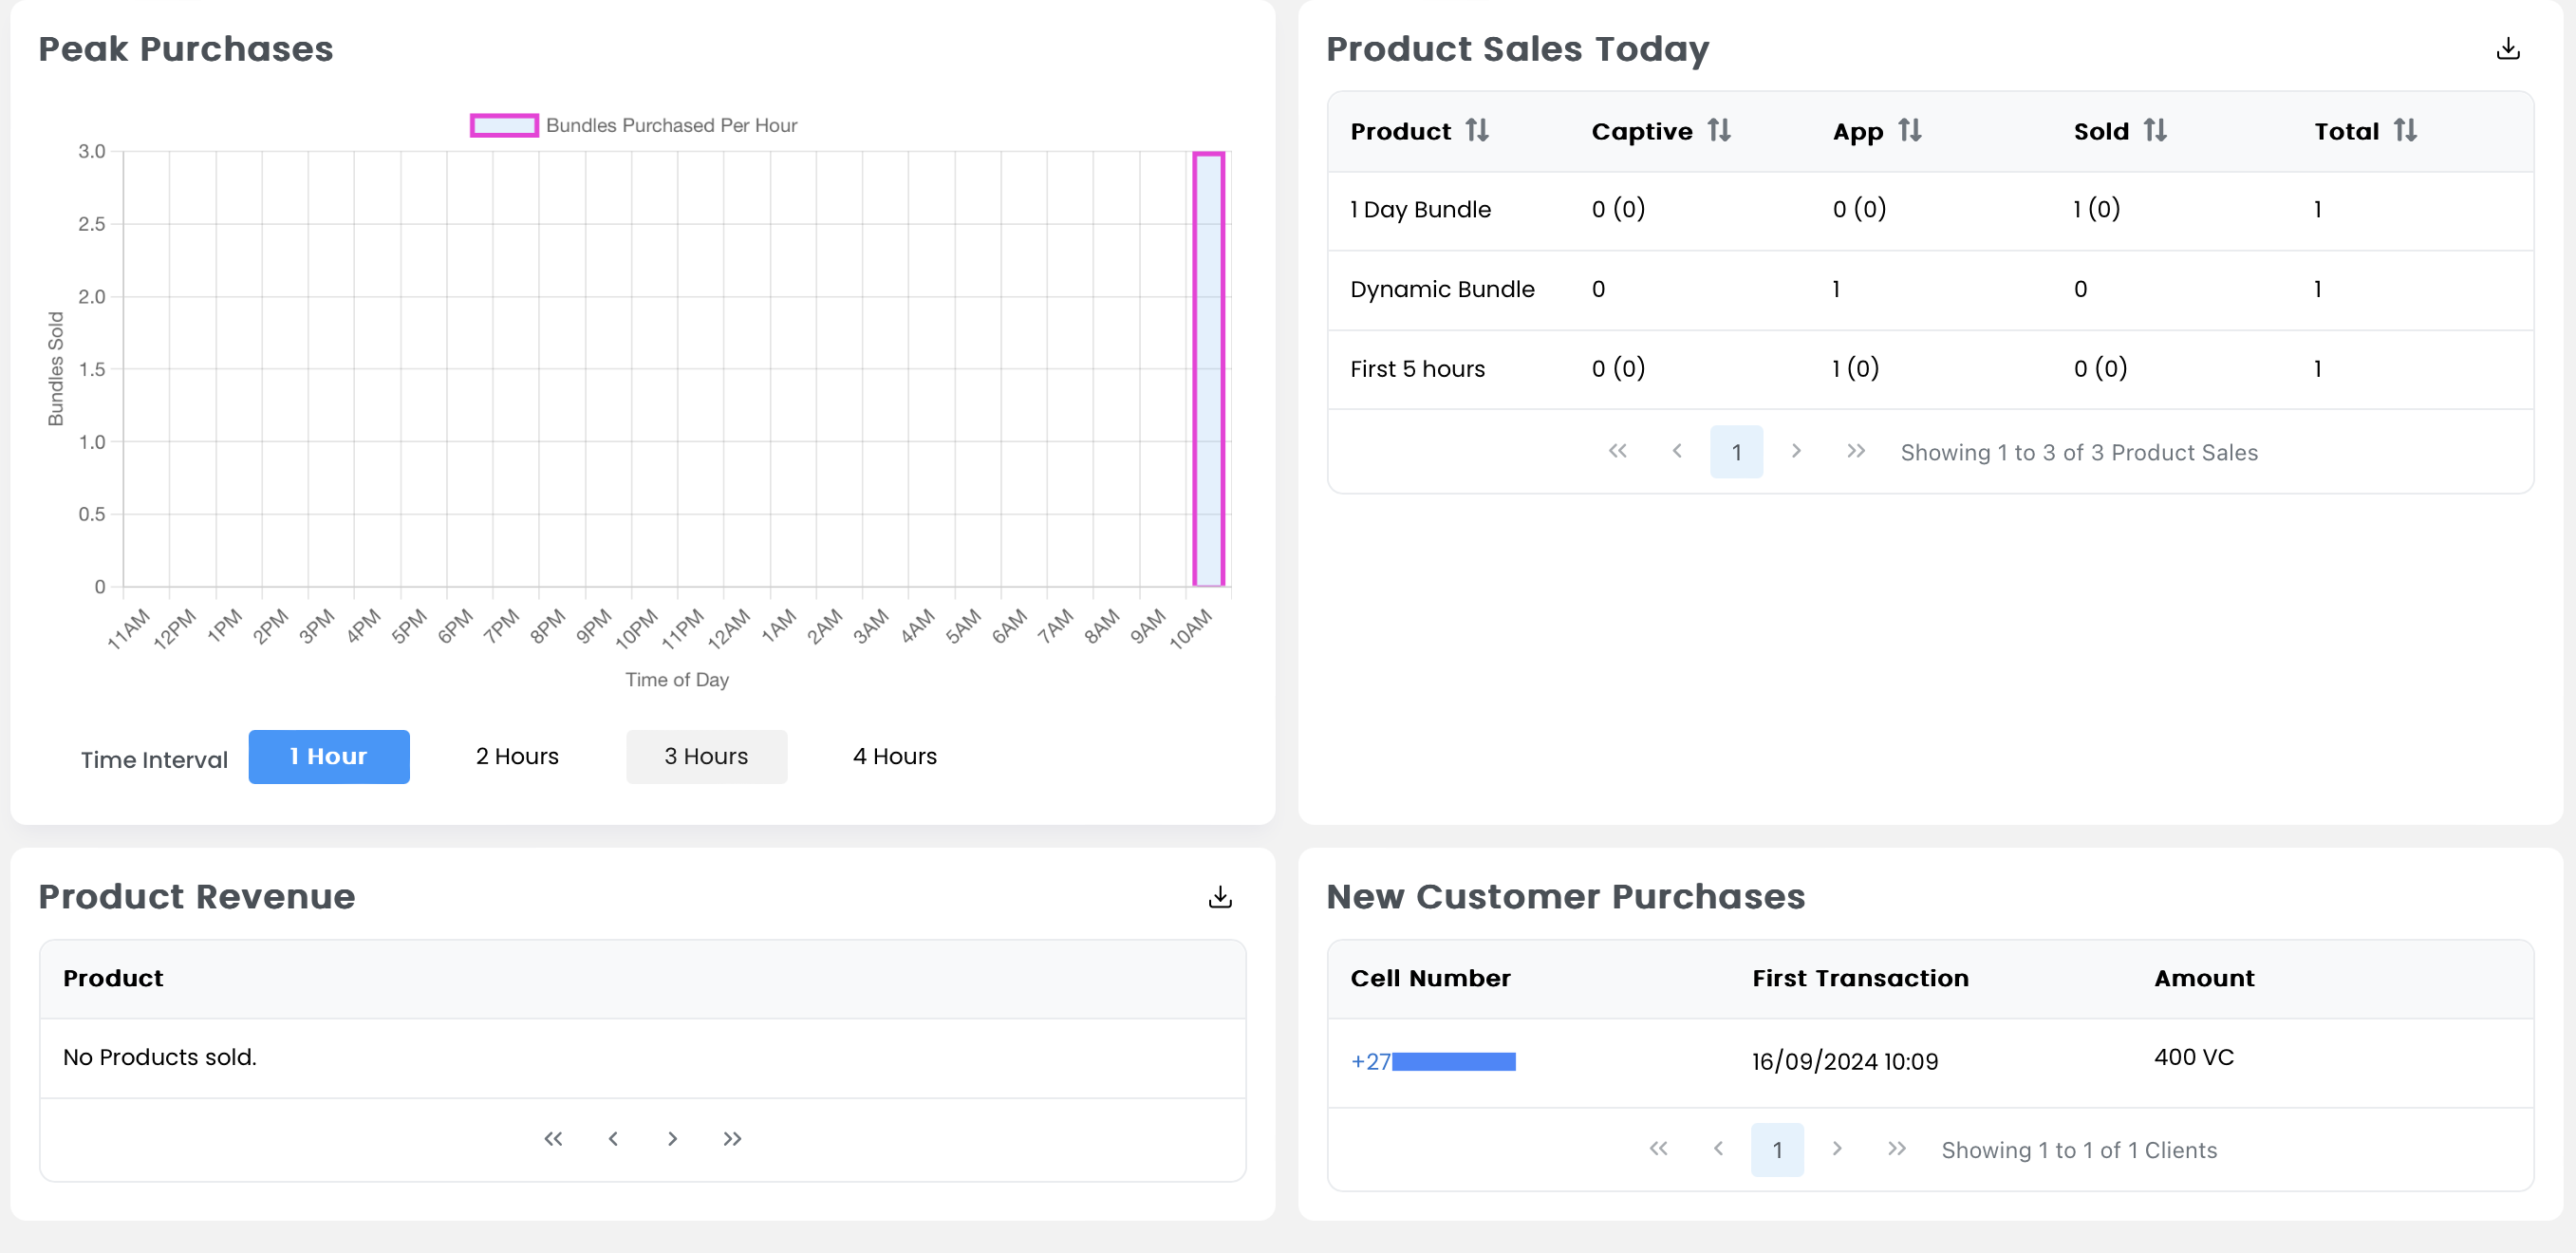
Screenshot 2023-05-04 at 13.33.47

Screenshot 2023-05-04 at 13.31.08

Screenshot 2023-05-04 at 13.31.29


1. Peak Data Sent 

      • This graph is a visual representation of the total amount of data that is uploaded or downloaded through all of your hotspots by users/customers in the last 24 hours (time vs MB). 
      • This can be viewed in a 1-, 2-, 3-, or 4-hour interval by clicking the appropriate button under the graph.

2. Peak Customers

      • This graph is a visual representation of the total number of customers that have connected to any of your hotspots in the last 24 hours (time vs number of customers). 
      • This can be viewed in a 1-, 2-, 3-, or 4-hour interval by clicking the appropriate button under the gr

3. Peak Purchases 

      • This graph is a visual representation of the number of VC purchased in the last 24 hours (time vs VC purchased). 
      • This can be viewed in a 1-, 2-, 3-, or 4-hour interval by clicking the appropriate button under the graph.

4. Product Sales Today **VulaConnect

      • This table is a visual representation of the total number of products that have been sold Today. 
      • This includes a breakdown of where each products has been sold (Captive Portal, App/Wallet & Sold/Reseller).
      • This table also includes the total number of products sold with the VulaCoin value of the number of sales.

5. Product Sales Today **VulaConnect

      • This table shows the product revenue per bundle sold. It shows the number of specific payment option used per bundle.

6. New Customer Purchases

      • This table show the number of users that transacted for the first time Today and the VulaCoin value that was spent. 

What's Next